Asimudeen Sahabudeen

Description
Hello! I’m a Data Enthusiast with a passion for uncovering insights from raw information and using them to drive decision-making and innovation. What fuels my enthusiasm for data? It’s the thrill of diving deep into datasets, the challenge of transforming complex patterns into understandable insights, and the satisfaction of seeing those insights inform strategic decisions. I believe that in our data-driven world, the ability to interpret and utilize data is not just a skill, but a language that every industry should speak. Beyond my love for data, I’m an adventurer at heart. I’m always on the lookout for new challenges and learning opportunities, whether that’s mastering a new data visualization tool or exploring a new city. View My LinkedIn Profile
Time-Series Analysis of Energy Consumption in Hong Kong: This project involves a comprehensive analysis of energy consumption patterns in Hong Kong. It utilizes various data analysis techniques and machine learning models to understand trends, make predictions, and derive insights from complex energy usage data.
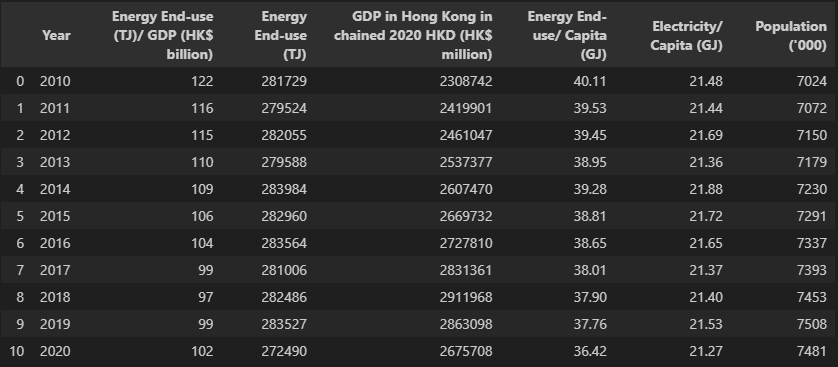
Overview [Key Energy End-use]
import requests
import pandas as pd
import io
import numpy as np

# Send a GET request to the API endpoint
response = requests.get('https://api.data.gov.hk/v1/historical-archive/get-file?url=https%3A%2F%2Fwww.emsd.gov.hk%2Ffilemanager%2Fen%2Fshare%2Fenergy_efficiency%2Fenergy_end_use%2F2022%2Ftable01.csv&time=20221019-1038')

# Check if the request was successful
if response.status_code == 200:
    #convert it into a file-like object
    data_io = io.StringIO(response.text)

    df_overview = pd.read_csv(data_io)
    print('Data read successfully.')
else:
    print(f'Request failed with status code {response.status_code}')
::: {.output .stream .stdout} Data read successfully. :::
df_overview
Total Energy Consumption by fuel
# Send a GET request to the API endpoint
response = requests.get('https://api.data.gov.hk/v1/historical-archive/get-file?url=https%3A%2F%2Fwww.emsd.gov.hk%2Ffilemanager%2Fen%2Fshare%2Fenergy_efficiency%2Fenergy_end_use%2F2022%2Ftable02.csv&time=20231007-1113')
# Check if the request was successful
if response.status_code == 200:
    #convert it into a file-like object
    data_io = io.StringIO(response.text)

    df_total_fuel = pd.read_csv(data_io)
    print('Data read successfully.')
else:
    print(f'Request failed with status code {response.status_code}')
::: {.output .stream .stdout} Data read successfully.
df_total_fuel
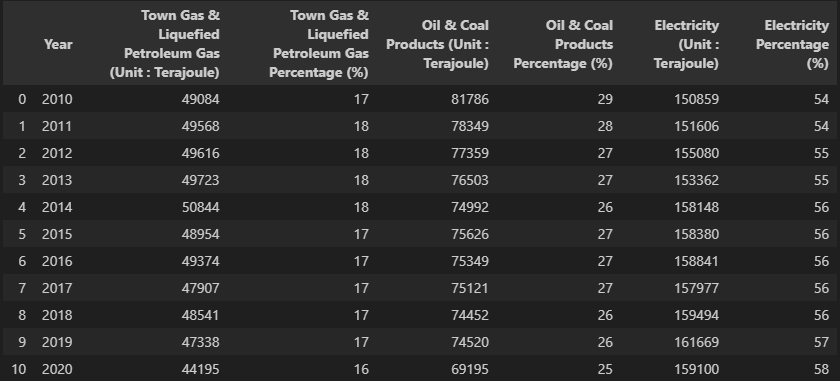
Energy Consumption in Residential Sector by Fuel
# Send a GET request to the API endpoint
response = requests.get('https://api.data.gov.hk/v1/historical-archive/get-file?url=https%3A%2F%2Fwww.emsd.gov.hk%2Ffilemanager%2Fen%2Fshare%2Fenergy_efficiency%2Fenergy_end_use%2F2022%2Ftable03.csv&time=20231007-1112')
# Check if the request was successful
if response.status_code == 200:
    #convert it into a file-like object
    data_io = io.StringIO(response.text)

    df_residential_fuel = pd.read_csv(data_io)
    print('Data read successfully.')
else:
    print(f'Request failed with status code {response.status_code}')
::: {.output .stream .stdout} Data read successfully. ::: :::
df_residential_fuel

Energy Consumption in Commercial Sector by Fuel
# Send a GET request to the API endpoint
response = requests.get('https://api.data.gov.hk/v1/historical-archive/get-file?url=https%3A%2F%2Fwww.emsd.gov.hk%2Ffilemanager%2Fen%2Fshare%2Fenergy_efficiency%2Fenergy_end_use%2F2022%2Ftable04.csv&time=20231007-1113')
# Check if the request was successful
if response.status_code == 200:
    #convert it into a file-like object
    data_io = io.StringIO(response.text)

    df_commercial_fuel = pd.read_csv(data_io)
    print('Data read successfully.')
else:
    print(f'Request failed with status code {response.status_code}')
::: {.output .stream .stdout} Data read successfully. :::
df_commercial_fuel
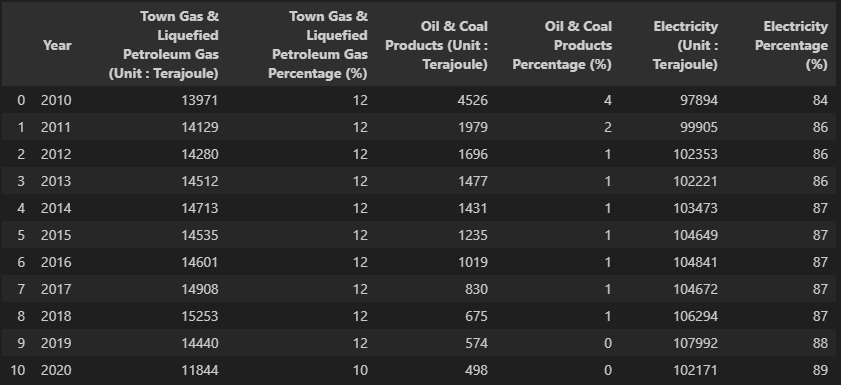
Energy Consumption in Industrial Sector by Fuel
# Send a GET request to the API endpoint
response = requests.get('https://api.data.gov.hk/v1/historical-archive/get-file?url=https%3A%2F%2Fwww.emsd.gov.hk%2Ffilemanager%2Fen%2Fshare%2Fenergy_efficiency%2Fenergy_end_use%2F2022%2Ftable05.csv&time=20231007-1113')
# Check if the request was successful
if response.status_code == 200:
    #convert it into a file-like object
    data_io = io.StringIO(response.text)

    df_industrial_fuel = pd.read_csv(data_io)
    print('Data read successfully.')
else:
    print(f'Request failed with status code {response.status_code}')
::: {.output .stream .stdout} Data read successfully. :::
df_industrial_fuel
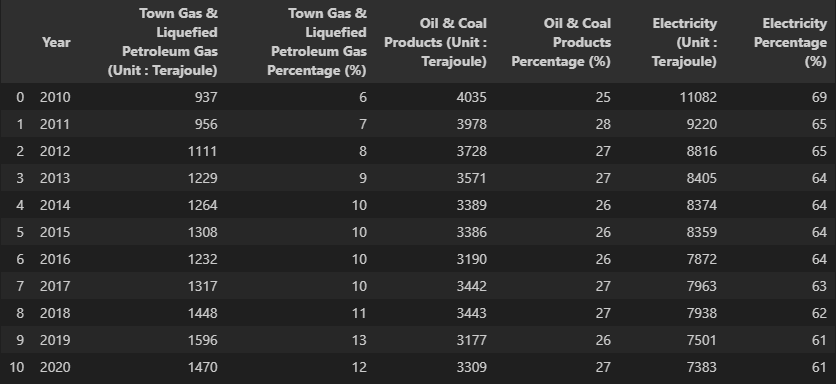
Energy Consumption in Transport Sector by Fuel
# Send a GET request to the API endpoint
response = requests.get('https://api.data.gov.hk/v1/historical-archive/get-file?url=https%3A%2F%2Fwww.emsd.gov.hk%2Ffilemanager%2Fen%2Fshare%2Fenergy_efficiency%2Fenergy_end_use%2F2022%2Ftable06.csv&time=20231007-1118')
# Check if the request was successful
if response.status_code == 200:
    #convert it into a file-like object
    data_io = io.StringIO(response.text)

    df_transport_fuel = pd.read_csv(data_io)
    print('Data read successfully.')
else:
    print(f'Request failed with status code {response.status_code}')
::: {.output .stream .stdout} Data read successfully. :::
df_transport_fuel

Total Energy Consumption by Sector
# Send a GET request to the API endpoint
response = requests.get('https://api.data.gov.hk/v1/historical-archive/get-file?url=https%3A%2F%2Fwww.emsd.gov.hk%2Ffilemanager%2Fen%2Fshare%2Fenergy_efficiency%2Fenergy_end_use%2F2022%2Ftable07.csv&time=20231007-1110')
# Check if the request was successful
if response.status_code == 200:
    #convert it into a file-like object
    data_io = io.StringIO(response.text)

    df_energy_sector = pd.read_csv(data_io)
    print('Data read successfully.')
else:
    print(f'Request failed with status code {response.status_code}')
::: {.output .stream .stdout} Data read successfully. :::
df_energy_sector
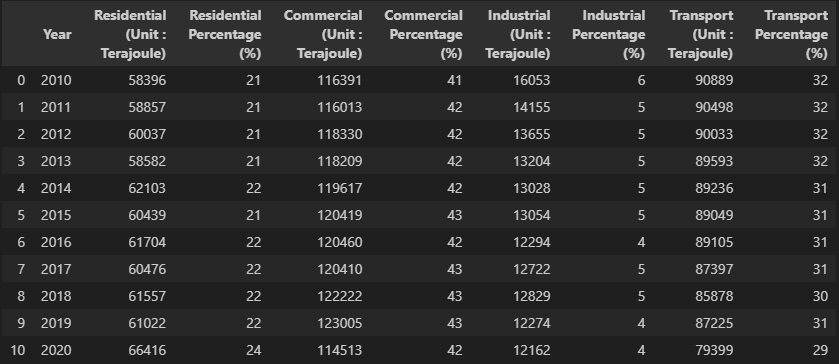
Electricity Consumption by Sector
# Send a GET request to the API endpoint
response = requests.get('https://www.emsd.gov.hk/filemanager/en/share/energy_efficiency/energy_end_use/2022/table08.csv')
# Check if the request was successful
if response.status_code == 200:
    #convert it into a file-like object
    data_io = io.StringIO(response.text)

    df_electricity_sector = pd.read_csv(data_io)
    print('Data read successfully.')
else:
    print(f'Request failed with status code {response.status_code}')
::: {.output .stream .stdout} Data read successfully. :::
df_electricity_sector
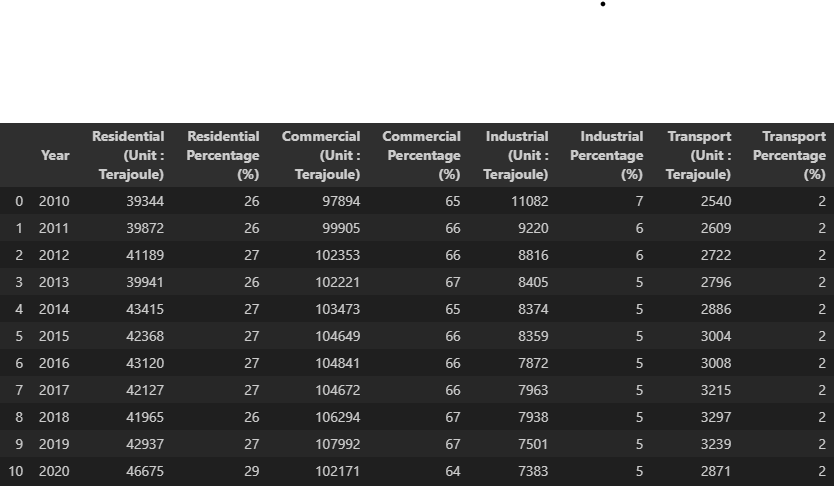
Oil & Coal Products Consumption by Sector
# Send a GET request to the API endpoint
response = requests.get('https://www.emsd.gov.hk/filemanager/en/share/energy_efficiency/energy_end_use/2022/table09.csv')
# Check if the request was successful
if response.status_code == 200:
    #convert it into a file-like object
    data_io = io.StringIO(response.text)

    df_oilcoal_sector = pd.read_csv(data_io)
    print('Data read successfully.')
else:
    print(f'Request failed with status code {response.status_code}')
::: {.output .stream .stdout} Data read successfully. :::
df_oilcoal_sector
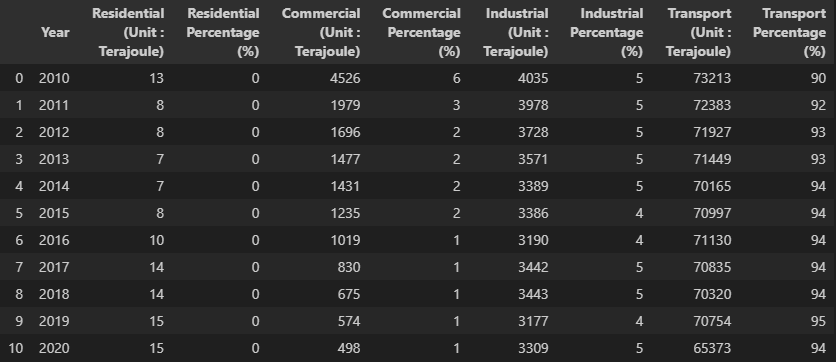
Town Gas & LPG Consumption by Sector
# Send a GET request to the API endpoint
response = requests.get('https://www.emsd.gov.hk/filemanager/en/share/energy_efficiency/energy_end_use/2022/table10.csv')
# Check if the request was successful
if response.status_code == 200:
    #convert it into a file-like object
    data_io = io.StringIO(response.text)

    df_gaslpg_sector = pd.read_csv(data_io)
    print('Data read successfully.')
else:
    print(f'Request failed with status code {response.status_code}')
::: {.output .stream .stdout} Data read successfully. :::
df_gaslpg_sector
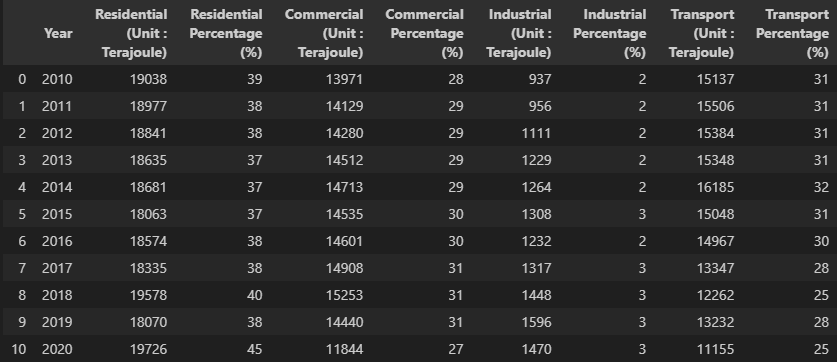
Total Energy Consumption by End-use
# Send a GET request to the API endpoint
response = requests.get('https://www.emsd.gov.hk/filemanager/en/share/energy_efficiency/energy_end_use/2022/table11.csv')
# Check if the request was successful
if response.status_code == 200:
    #convert it into a file-like object
    data_io = io.StringIO(response.text)

    df_energy_enduse = pd.read_csv(data_io)
    print('Data read successfully.')
else:
    print(f'Request failed with status code {response.status_code}')
::: {.output .stream .stdout} Data read successfully. :::
df_energy_enduse

Electricity Consumption by End-use
# Send a GET request to the API endpoint
response = requests.get('https://www.emsd.gov.hk/filemanager/en/share/energy_efficiency/energy_end_use/2022/table12.csv')
# Check if the request was successful
if response.status_code == 200:
    #convert it into a file-like object
    data_io = io.StringIO(response.text)

    df_electricity_enduse = pd.read_csv(data_io)
    print('Data read successfully.')
else:
    print(f'Request failed with status code {response.status_code}')
::: {.output .stream .stdout} Data read successfully. :::
df_electricity_enduse

Oil & Coal Products Consumption by End-use
# Send a GET request to the API endpoint
response = requests.get('https://www.emsd.gov.hk/filemanager/en/share/energy_efficiency/energy_end_use/2022/table13.csv')
# Check if the request was successful
if response.status_code == 200:
    #convert it into a file-like object
    data_io = io.StringIO(response.text)

    df_oilcoal_enduse = pd.read_csv(data_io)
    print('Data read successfully.')
else:
    print(f'Request failed with status code {response.status_code}')
::: {.output .stream .stdout} Data read successfully. :::
df_oilcoal_enduse

Town Gas & Liquefied Petroleum Gas Consumption by End-use
# Send a GET request to the API endpoint
response = requests.get('https://www.emsd.gov.hk/filemanager/en/share/energy_efficiency/energy_end_use/2022/table14.csv')
# Check if the request was successful
if response.status_code == 200:
    #convert it into a file-like object
    data_io = io.StringIO(response.text)

    df_gaslpg_enduse = pd.read_csv(data_io)
    print('Data read successfully.')
else:
    print(f'Request failed with status code {response.status_code}')
::: {.output .stream .stdout} Data read successfully. :::
df_gaslpg_enduse
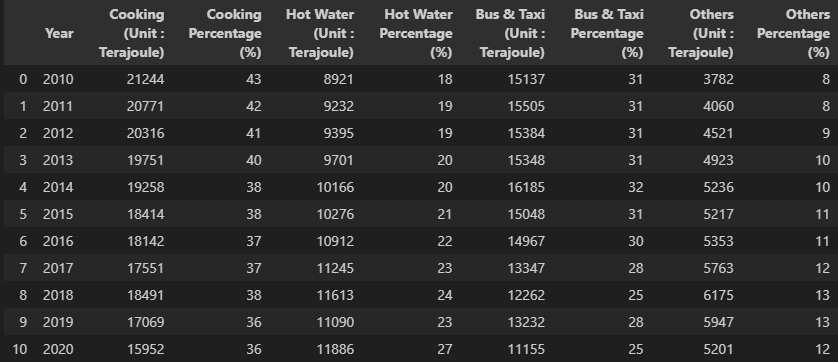
Type of Renewable Energy in Hong Kong
# Send a GET request to the API endpoint
response = requests.get('https://www.emsd.gov.hk/filemanager/en/share/energy_efficiency/energy_end_use/2022/table15.csv')
# Check if the request was successful
if response.status_code == 200:
    #convert it into a file-like object
    data_io = io.StringIO(response.text)

    df_energy_renewable = pd.read_csv(data_io)
    print('Data read successfully.')
else:
    print(f'Request failed with status code {response.status_code}')
::: {.output .stream .stdout} Data read successfully. :::
df_energy_renewable

Type of Renewable Energy in Hong Kong by Fuel
# Send a GET request to the API endpoint
response = requests.get('https://www.emsd.gov.hk/filemanager/en/share/energy_efficiency/energy_end_use/2022/table16.csv')
# Check if the request was successful
if response.status_code == 200:
    #convert it into a file-like object
    data_io = io.StringIO(response.text)

    df_energy_renewable_fuel = pd.read_csv(data_io)
    print('Data read successfully.')
else:
    print(f'Request failed with status code {response.status_code}')
::: {.output .stream .stdout} Data read successfully. :::
df_energy_renewable_fuel

dataframes = [df_overview, df_total_fuel, df_residential_fuel, df_commercial_fuel, df_industrial_fuel,
              df_transport_fuel, df_energy_sector, df_electricity_sector, df_oilcoal_sector,
              df_gaslpg_sector, df_energy_enduse, df_electricity_enduse, df_oilcoal_enduse,
              df_gaslpg_enduse, df_energy_renewable, df_energy_renewable_fuel]
:::
::: {.cell .code execution_count=”34” colab=”{"base_uri":"https://localhost:8080/"}” id=”l_6AkCIux7b5” outputId=”f3418c2d-85d3-4fe3-96a2-06ac2bde1926”}
for df in dataframes:
    print(df.shape)
::: {.output .stream .stdout} (11, 7) (11, 7) (11, 7) (11, 7) (11, 7) (11, 7) (11, 9) (11, 9) (11, 9) (11, 9) (11, 29) (11, 19) (11, 17) (11, 9) (4, 3) (3, 5) :::
for df in dataframes:
    print(df.isnull().sum())
import plotly.express as px
import plotly.graph_objects as go
import plotly.figure_factory as ff

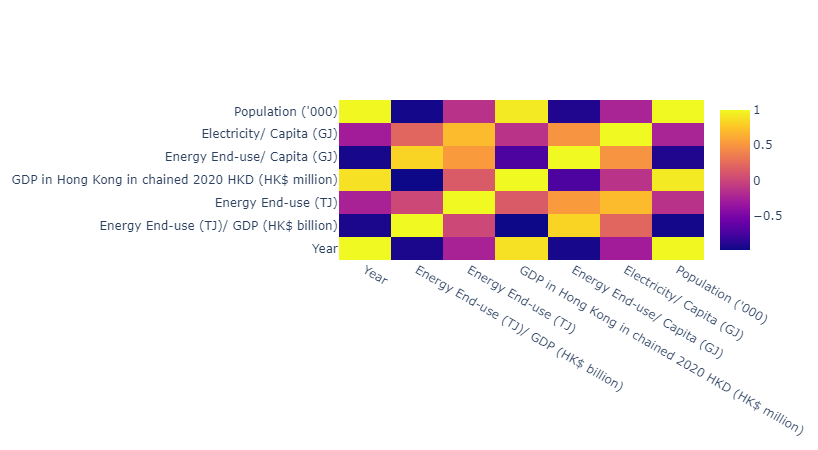
# Heatmap
df_corr = df_overview.corr()
fig = go.Figure(data=go.Heatmap(z=df_corr.values.tolist(), x=df_corr.columns.tolist(), y=df_corr.columns.tolist()))
fig.show()
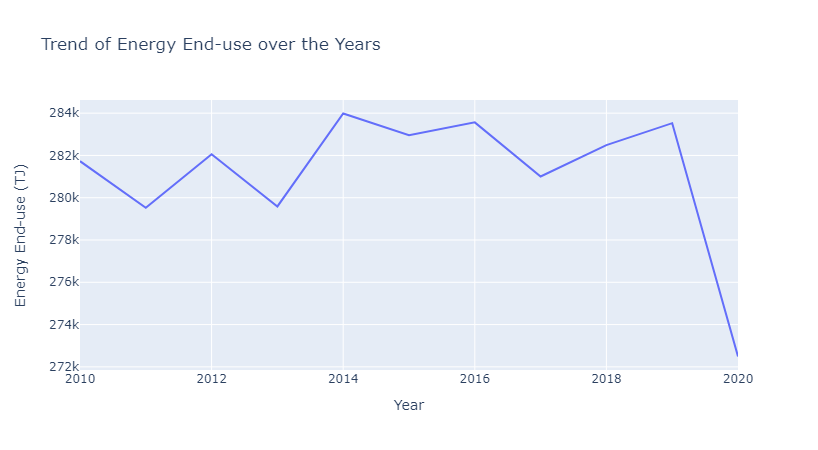
# Line plot for 'Trend of Energy End-use over the Years'
fig = px.line(df_overview, x='Year', y='Energy End-use (TJ)', title='Trend of Energy End-use over the Years')
fig.show()
from sklearn.model_selection import train_test_split
from sklearn.linear_model import LinearRegression

X = df_overview.drop('Energy End-use (TJ)', axis=1)
y = df_overview['Energy End-use (TJ)']

X_train, X_test, y_train, y_test = train_test_split(X, y, test_size=0.2, random_state=42)

model = LinearRegression()
model.fit(X_train, y_train)

predictions = model.predict(X_test)
:::
print(predictions)
::: {.output .stream .stdout} [282930.20184256 281933.44935531 283681.35070016] ::: :::
from sklearn.metrics import mean_absolute_error, mean_squared_error

print("MAE: ", mean_absolute_error(y_test, predictions))
print("MSE: ", mean_squared_error(y_test, predictions))
print("RMSE: ", np.sqrt(mean_squared_error(y_test, predictions)))
::: {.output .stream .stdout} MAE: 129.532737636182 MSE: 22170.535904252512 RMSE: 148.89773639734256 ::: :::
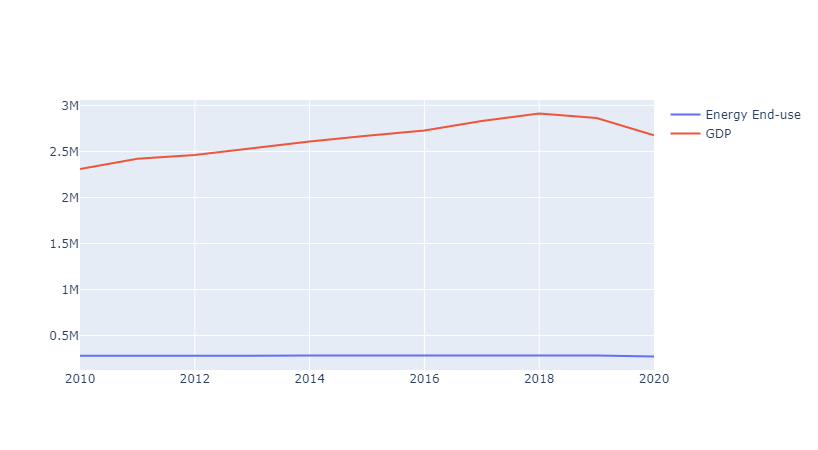
# Line plot for 'Trend of Energy End-use and GDP over the Years'
fig = go.Figure()
fig.add_trace(go.Scatter(x=df_overview['Year'], y=df_overview['Energy End-use (TJ)'], mode='lines', name='Energy End-use'))
fig.add_trace(go.Scatter(x=df_overview['Year'], y=df_overview['GDP in Hong Kong in chained 2020 HKD (HK$ million)'], mode='lines', name='GDP'))
fig.show()
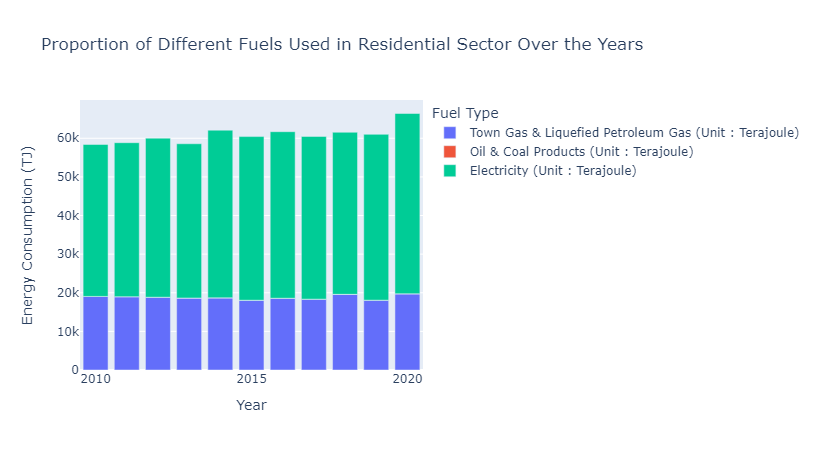
# Grouped bar plot for 'Proportion of Different Fuels Used in Residential Sector Over the Years'
df_melted = pd.melt(df_residential_fuel, id_vars='Year', value_vars=['Town Gas & Liquefied Petroleum Gas (Unit : Terajoule)', 'Oil & Coal Products (Unit : Terajoule)', 'Electricity (Unit : Terajoule)'])
fig = px.bar(df_melted, x='Year', y='value', color='variable', title='Proportion of Different Fuels Used in Residential Sector Over the Years', labels={'value':'Energy Consumption (TJ)', 'variable':'Fuel Type'})
fig.show()
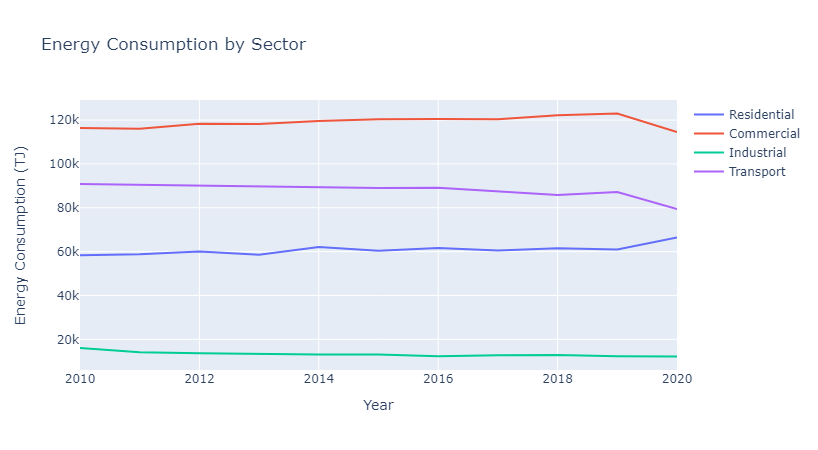
# Line plot for 'Energy Consumption by Sector'
fig = go.Figure()
fig.add_trace(go.Scatter(x=df_energy_sector['Year'], y=df_energy_sector['Residential (Unit : Terajoule)'], mode='lines', name='Residential'))
fig.add_trace(go.Scatter(x=df_energy_sector['Year'], y=df_energy_sector['Commercial (Unit : Terajoule)'], mode='lines', name='Commercial'))
fig.add_trace(go.Scatter(x=df_energy_sector['Year'], y=df_energy_sector['Industrial (Unit : Terajoule)'], mode='lines', name='Industrial'))
fig.add_trace(go.Scatter(x=df_energy_sector['Year'], y=df_energy_sector['Transport (Unit : Terajoule)'], mode='lines', name='Transport'))
fig.update_layout(title='Energy Consumption by Sector', xaxis_title='Year', yaxis_title='Energy Consumption (TJ)')
fig.show()
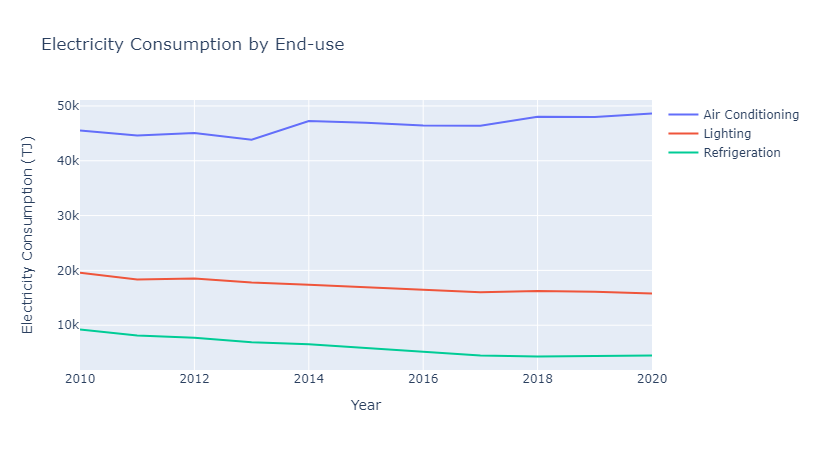
# Line plot for 'Electricity Consumption by End-use'
fig = go.Figure()
fig.add_trace(go.Scatter(x=df_electricity_enduse['Year'], y=df_electricity_enduse['Air Conditioning (Unit : Terajoule)'], mode='lines', name='Air Conditioning'))
fig.add_trace(go.Scatter(x=df_electricity_enduse['Year'], y=df_electricity_enduse['Lighting (Unit : Terajoule)'], mode='lines', name='Lighting'))
fig.add_trace(go.Scatter(x=df_electricity_enduse['Year'], y=df_electricity_enduse['Refrigeration (Unit : Terajoule)'], mode='lines', name='Refrigeration'))
fig.update_layout(title='Electricity Consumption by End-use', xaxis_title='Year', yaxis_title='Electricity Consumption (TJ)')
fig.show()
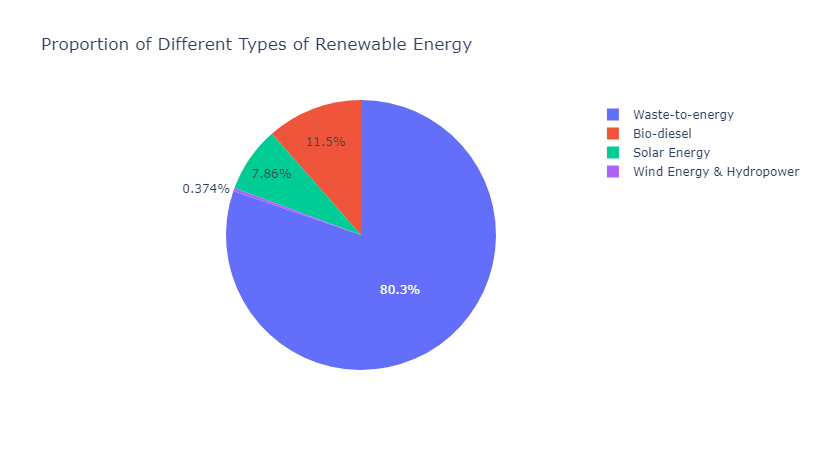
# Pie chart for 'Proportion of Different Types of Renewable Energy'
fig = go.Figure(data=[go.Pie(labels=df_energy_renewable['Type of Renewable Energy'].values, values=df_energy_renewable['Renewable Energy (Unit : Terajoule)'].values)])
fig.update_layout(title_text='Proportion of Different Types of Renewable Energy')
fig.show()
