Asimudeen Sahabudeen

Description
Hello! I’m a Data Enthusiast with a passion for uncovering insights from raw information and using them to drive decision-making and innovation. What fuels my enthusiasm for data? It’s the thrill of diving deep into datasets, the challenge of transforming complex patterns into understandable insights, and the satisfaction of seeing those insights inform strategic decisions. I believe that in our data-driven world, the ability to interpret and utilize data is not just a skill, but a language that every industry should speak. Beyond my love for data, I’m an adventurer at heart. I’m always on the lookout for new challenges and learning opportunities, whether that’s mastering a new data visualization tool or exploring a new city. View My LinkedIn Profile
This is a simple exploratory data analysis on 5 stocks (AAPL, MSFT, GOOGL, META & JFU) - prediction, correlation, and risk assesmennt, using python libraries and machine learning algorithms.
Import libraries
# Import necessary libraries
import yfinance as yf
import pandas as pd
import numpy as np
from sklearn.model_selection import train_test_split
from sklearn.linear_model import LinearRegression
from sklearn.tree import DecisionTreeRegressor
from sklearn.ensemble import RandomForestRegressor
from sklearn.preprocessing import StandardScaler
from sklearn.decomposition import PCA
import matplotlib.pyplot as plt
from datetime import timedelta
import seaborn as sns
from statsmodels.tsa.seasonal import seasonal_decompose
Define the tickers
# Define the stocks to be fetched
symbols = ['AAPL', 'MSFT', 'GOOGL', 'META', 'JFU']

# Fetch stock data from Yahoo Finance
data = yf.download(symbols,'2020-01-01','2023-09-01')
print(data.head())
            Adj Close                                                Close  \
                 AAPL      GOOGL    JFU        META        MSFT       AAPL
Date
2020-01-02  73.249023  68.433998  190.0  209.779999  155.093674  75.087502
2020-01-03  72.536896  68.075996  190.0  208.669998  153.162460  74.357498
2020-01-06  73.114883  69.890503  190.0  212.600006  153.558380  74.949997
2020-01-07  72.771034  69.755501  190.0  213.059998  152.158279  74.597504
2020-01-08  73.941658  70.251999  187.0  215.220001  154.581924  75.797501

                                                      ...       Open  \
                GOOGL    JFU        META        MSFT  ...       AAPL
Date                                                  ...
2020-01-02  68.433998  190.0  209.779999  160.619995  ...  74.059998
2020-01-03  68.075996  190.0  208.669998  158.619995  ...  74.287498
2020-01-06  69.890503  190.0  212.600006  159.029999  ...  73.447502
2020-01-07  69.755501  190.0  213.059998  157.580002  ...  74.959999
2020-01-08  70.251999  187.0  215.220001  160.089996  ...  74.290001

                                                              Volume  \
                GOOGL         JFU        META        MSFT       AAPL
Date
2020-01-02  67.420502  187.000000  206.750000  158.779999  135480400
2020-01-03  67.400002  182.199997  207.210007  158.320007  146322800
2020-01-06  67.581497  184.199997  206.699997  157.080002  118387200
2020-01-07  70.023003  196.199997  212.820007  159.320007  108872000
2020-01-08  69.740997  186.059998  213.000000  158.929993  132079200


             GOOGL   JFU      META      MSFT
Date
2020-01-02  27278000  2780  12077100  22622100
2020-01-03  23408000    30  11188400  21116200
2020-01-06  46768000   225  17058900  20813700
2020-01-07  34330000  4465  14912400  21634100
2020-01-08  35314000   520  13475000  27746500

[5 rows x 30 columns]
Moving averages and Relative Strength Index
# Calculate moving averages and RSI for each stock symbol
for symbol in symbols:
    # Calculate 14-day RSI
    delta = data['Close'][symbol].diff()
    up, down = delta.copy(), delta.copy()
    up[up < 0] = 0
    down[down > 0] = 0
    average_gain = up.rolling(window=14).mean()
    average_loss = abs(down.rolling(window=14).mean())
    rs = average_gain / average_loss
    data[symbol+'_RSI'] = 100 - (100 / (1 + rs))

    # Calculate 50-day moving average
    data[symbol+'_MA50'] = data['Close'][symbol].rolling(window=50).mean()

    # Calculate 200-day moving average
    data[symbol+'_MA200'] = data['Close'][symbol].rolling(window=200).mean()
# Predict for the next 'n' days using linear regression, decision tree regressor, and random forest regressor
forecast_out = 30

# Create another column shifted 'n' units up for each stock symbol
for symbol in symbols:
    data[symbol+'_Prediction'] = data['Close'][symbol].shift(-forecast_out)
Training Models
# Create the independent and dependent data sets for each stock symbol and train models
for symbol in symbols:
    X = np.array(data.drop([symbol+'_Prediction'], 1))[:-forecast_out]
    y = np.array(data[symbol+'_Prediction'].dropna())

    # Split the data into 80% training and 20% testing
    x_train, x_test, y_train, y_test = train_test_split(X, y, test_size=0.2)

    # Standardize the features for better performance using StandardScaler
    scaler = StandardScaler()
    x_train_scaled = scaler.fit_transform(x_train)
    x_test_scaled = scaler.transform(x_test)

    # Fill NaN values with 0 because PCA contains NaN values, which causes errors
    x_train_scaled = np.nan_to_num(x_train_scaled)
    x_test_scaled = np.nan_to_num(x_test_scaled)

    # Apply PCA for dimensionality reduction
    #https://www.geeksforgeeks.org/dimensionality-reduction/
    pca = PCA(n_components=2)
    x_train_pca = pca.fit_transform(x_train_scaled)
    x_test_pca = pca.transform(x_test_scaled)

    #Linear Regression Model w/ PCA transformed data
    lr = LinearRegression()
    lr.fit(x_train_pca, y_train)

    #Decision Tree Regressor Model w/ and PCA transformed data
    tree = DecisionTreeRegressor()
    tree.fit(x_train_pca, y_train)

    #Random Forest Regressor Model w/ PCA transformed data
    forest = RandomForestRegressor()
    forest.fit(x_train_pca, y_train)

    #Test the models
    lr_confidence = lr.score(x_test_pca, y_test)
    tree_confidence = tree.score(x_test_pca, y_test)
    forest_confidence = forest.score(x_test_pca, y_test)

    print(symbol + " Linear Regression Confidence: ", lr_confidence)
    print(symbol + " Decision Tree Confidence: ", tree_confidence)
    print(symbol + " Random Forest Confidence: ", forest_confidence)


#.iloc is not working
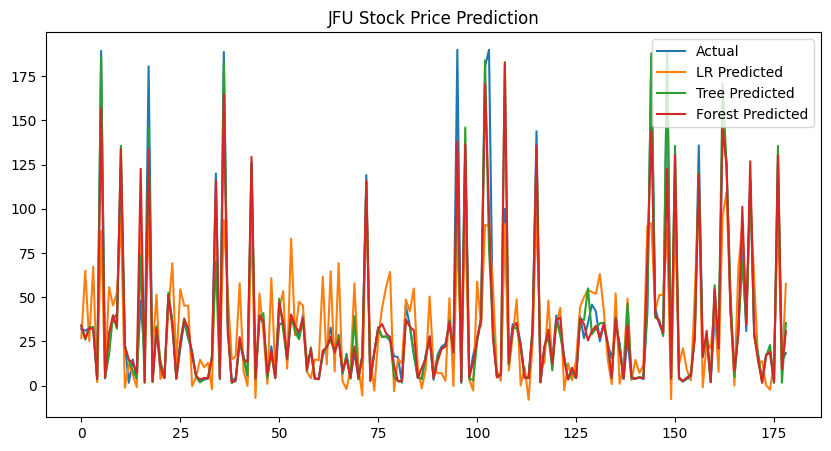
AAPL Linear Regression Confidence:  0.8693749526815797
AAPL Decision Tree Confidence:  0.9081605516537108
AAPL Random Forest Confidence:  0.9468460793945255

MSFT Linear Regression Confidence:  0.8035098620081532
MSFT Decision Tree Confidence:  0.8417873573839362
MSFT Random Forest Confidence:  0.9058770578190273

GOOGL Linear Regression Confidence:  0.8837169010119778
GOOGL Decision Tree Confidence:  0.9285290838698419
GOOGL Random Forest Confidence:  0.9503598628042024

META Linear Regression Confidence:  0.7496966470619988
META Decision Tree Confidence:  0.8259379697861178
META Random Forest Confidence:  0.888153590092148

JFU Linear Regression Confidence:  0.6217064867191909
JFU Decision Tree Confidence:  0.9017686032831084
JFU Random Forest Confidence:  0.8934490293521452
Correlation
# Correlation Analysis
correlation_matrix = data.corr()
print("Correlation Matrix:")
print(correlation_matrix)
Correlation Matrix:
Adj Close \
AAPL GOOGL JFU META MSFT
Adj Close AAPL 1.000000 0.808847 -0.812810 0.181220 0.934111
GOOGL 0.808847 1.000000 -0.555156 0.504299 0.910637
JFU -0.812810 -0.555156 1.000000 -0.074040 -0.683986
META 0.181220 0.504299 -0.074040 1.000000 0.389772
MSFT 0.934111 0.910637 -0.683986 0.389772 1.000000
Close AAPL 0.999870 0.813587 -0.813391 0.191361 0.934948
GOOGL 0.808847 1.000000 -0.555156 0.504299 0.910637
JFU -0.812810 -0.555156 1.000000 -0.074040 -0.683986
META 0.181220 0.504299 -0.074040 1.000000 0.389772
MSFT 0.927045 0.918937 -0.676471 0.412579 0.999452
High AAPL 0.998769 0.810231 -0.816160 0.184809 0.930935
GOOGL 0.811826 0.998975 -0.558605 0.494979 0.910685
JFU -0.817450 -0.558369 0.997951 -0.070261 -0.687734
META 0.183317 0.505509 -0.076865 0.999045 0.391049
MSFT 0.928521 0.916743 -0.677260 0.404177 0.998250
Low AAPL 0.998872 0.814382 -0.811348 0.196924 0.935960
GOOGL 0.806415 0.999039 -0.553560 0.510244 0.908745
JFU -0.809815 -0.553197 0.998536 -0.077438 -0.681251
META 0.181600 0.504504 -0.075414 0.999107 0.389574
MSFT 0.925591 0.918989 -0.677049 0.419250 0.998011
Open AAPL 0.997534 0.810631 -0.814699 0.190835 0.931340
GOOGL 0.806978 0.997748 -0.553972 0.502339 0.907506
JFU -0.814353 -0.557352 0.996915 -0.075108 -0.684885
META 0.181448 0.503906 -0.075404 0.997885 0.388858
MSFT 0.926294 0.917250 -0.676686 0.411482 0.996508
Volume AAPL -0.624555 -0.549690 0.563616 -0.113204 -0.607588
GOOGL -0.254613 -0.279861 0.267165 -0.216487 -0.259348
JFU -0.063012 -0.058448 -0.018250 0.084874 -0.078593
META 0.116794 -0.023718 -0.139121 -0.378183 0.018999
MSFT -0.352783 -0.360663 0.389760 -0.240207 -0.346988
AAPL_RSI 0.035318 0.000714 0.046900 0.171164 0.083889
AAPL_MA50 0.946222 0.767983 -0.775098 0.037803 0.857990
AAPL_MA200 0.702043 0.293582 -0.678744 -0.506567 0.514397
MSFT_RSI -0.040280 0.040184 0.122060 0.217570 0.080183
MSFT_MA50 0.911519 0.900906 -0.621369 0.286948 0.945327
MSFT_MA200 0.676077 0.475340 -0.472934 -0.379071 0.551254
GOOGL_RSI -0.040077 0.066534 0.055768 0.296819 0.042943
GOOGL_MA50 0.768528 0.955724 -0.476635 0.341690 0.849788
GOOGL_MA200 0.524766 0.532932 -0.278908 -0.313685 0.468223
META_RSI 0.027726 -0.059726 -0.037907 0.124645 0.075835
META_MA50 0.161920 0.575963 0.019252 0.928316 0.383616
META_MA200 -0.082795 0.661437 0.711459 0.530259 0.187283
JFU_RSI 0.040179 0.068153 0.043307 0.094762 0.033651
JFU_MA50 -0.815882 -0.542873 0.957676 -0.010755 -0.640459
JFU_MA200 -0.626970 -0.229370 0.613811 0.338345 -0.506549
AAPL_Prediction 0.905793 0.758888 -0.825721 0.177138 0.896489
MSFT_Prediction 0.813605 0.826936 -0.656857 0.392515 0.905047
GOOGL_Prediction 0.746650 0.921140 -0.573907 0.564483 0.866042
META_Prediction 0.030167 0.314538 -0.060635 0.871229 0.253607
JFU_Prediction -0.754602 -0.484465 0.937591 -0.007773 -0.637924
Close ... \
AAPL GOOGL JFU META MSFT ...
Adj Close AAPL 0.999870 0.808847 -0.812810 0.181220 0.927045 ...
GOOGL 0.813587 1.000000 -0.555156 0.504299 0.918937 ...
JFU -0.813391 -0.555156 1.000000 -0.074040 -0.676471 ...
META 0.191361 0.504299 -0.074040 1.000000 0.412579 ...
MSFT 0.934948 0.910637 -0.683986 0.389772 0.999452 ...
Close AAPL 1.000000 0.813587 -0.813391 0.191361 0.928359 ...
GOOGL 0.813587 1.000000 -0.555156 0.504299 0.918937 ...
JFU -0.813391 -0.555156 1.000000 -0.074040 -0.676471 ...
META 0.191361 0.504299 -0.074040 1.000000 0.412579 ...
MSFT 0.928359 0.918937 -0.676471 0.412579 1.000000 ...
High AAPL 0.998902 0.810231 -0.816160 0.184809 0.924255 ...
GOOGL 0.816498 0.998975 -0.558605 0.494979 0.918760 ...
JFU -0.817934 -0.558369 0.997951 -0.070261 -0.680005 ...
META 0.193495 0.505509 -0.076865 0.999045 0.413884 ...
MSFT 0.929749 0.916743 -0.677260 0.404177 0.998559 ...
Low AAPL 0.998962 0.814382 -0.811348 0.196924 0.929374 ...
GOOGL 0.811206 0.999039 -0.553560 0.510244 0.917164 ...
JFU -0.810469 -0.553197 0.998536 -0.077438 -0.673875 ...
META 0.191720 0.504504 -0.075414 0.999107 0.412328 ...
MSFT 0.926944 0.918989 -0.677049 0.419250 0.998629 ...
Open AAPL 0.997662 0.810631 -0.814699 0.190835 0.924713 ...
GOOGL 0.811743 0.997748 -0.553972 0.502339 0.915825 ...
JFU -0.814945 -0.557352 0.996915 -0.075108 -0.677350 ...
META 0.191601 0.503906 -0.075404 0.997885 0.411650 ...
MSFT 0.927610 0.917250 -0.676686 0.411482 0.996997 ...
Volume AAPL -0.622801 -0.549690 0.563616 -0.113204 -0.601319 ...
GOOGL -0.256743 -0.279861 0.267165 -0.216487 -0.262104 ...
JFU -0.060859 -0.058448 -0.018250 0.084874 -0.075658 ...
META 0.113972 -0.023718 -0.139121 -0.378183 0.011195 ...
MSFT -0.355096 -0.360663 0.389760 -0.240207 -0.349023 ...
AAPL_RSI 0.037606 0.000714 0.046900 0.171164 0.089516 ...
AAPL_MA50 0.944717 0.767983 -0.775098 0.037803 0.847132 ...
AAPL_MA200 0.690636 0.293582 -0.678744 -0.506567 0.485361 ...
MSFT_RSI -0.038238 0.040184 0.122060 0.217570 0.088029 ...
MSFT_MA50 0.912779 0.900906 -0.621369 0.286948 0.943743 ...
MSFT_MA200 0.672875 0.475340 -0.472934 -0.379071 0.536411 ...
GOOGL_RSI -0.037870 0.066534 0.055768 0.296819 0.049627 ...
GOOGL_MA50 0.773316 0.955724 -0.476635 0.341690 0.857045 ...
GOOGL_MA200 0.526099 0.532932 -0.278908 -0.313685 0.464190 ...
META_RSI 0.025280 -0.059726 -0.037907 0.124645 0.072548 ...
META_MA50 0.174809 0.575963 0.019252 0.928316 0.411357 ...
META_MA200 -0.060665 0.661437 0.711459 0.530259 0.228475 ...
JFU_RSI 0.040680 0.068153 0.043307 0.094762 0.033582 ...
JFU_MA50 -0.816111 -0.542873 0.957676 -0.010755 -0.629473 ...
JFU_MA200 -0.612354 -0.229370 0.613811 0.338345 -0.474775 ...
AAPL_Prediction 0.904094 0.758888 -0.825721 0.177138 0.888316 ...
MSFT_Prediction 0.813076 0.826936 -0.656857 0.392515 0.902444 ...
GOOGL_Prediction 0.750773 0.921140 -0.573907 0.564483 0.872800 ...
META_Prediction 0.037728 0.314538 -0.060635 0.871229 0.272042 ...
JFU_Prediction -0.753689 -0.484465 0.937591 -0.007773 -0.628735 ...
META_MA50 META_MA200 JFU_RSI JFU_MA50 JFU_MA200 \
Adj Close AAPL 0.161920 -0.082795 0.040179 -0.815882 -0.626970
GOOGL 0.575963 0.661437 0.068153 -0.542873 -0.229370
JFU 0.019252 0.711459 0.043307 0.957676 0.613811
META 0.928316 0.530259 0.094762 -0.010755 0.338345
MSFT 0.383616 0.187283 0.033651 -0.640459 -0.506549
Close AAPL 0.174809 -0.060665 0.040680 -0.816111 -0.612354
GOOGL 0.575963 0.661437 0.068153 -0.542873 -0.229370
JFU 0.019252 0.711459 0.043307 0.957676 0.613811
META 0.928316 0.530259 0.094762 -0.010755 0.338345
MSFT 0.411357 0.228475 0.033582 -0.629473 -0.474775
High AAPL 0.171637 -0.056573 0.037188 -0.818885 -0.610901
GOOGL 0.570803 0.663344 0.066738 -0.546090 -0.232895
JFU 0.021621 0.692439 0.044026 0.956483 0.616604
META 0.930873 0.535614 0.091859 -0.011031 0.340872
MSFT 0.407087 0.229660 0.030570 -0.630104 -0.478053
Low AAPL 0.179355 -0.063893 0.041312 -0.814116 -0.611756
GOOGL 0.580997 0.661590 0.068134 -0.541859 -0.224310
JFU 0.017508 0.726888 0.034514 0.958333 0.603077
META 0.927794 0.528176 0.094965 -0.014675 0.337544
MSFT 0.416506 0.227835 0.033450 -0.630846 -0.470741
Open AAPL 0.176439 -0.059073 0.037981 -0.817246 -0.609477
GOOGL 0.577280 0.665574 0.066313 -0.541486 -0.226137
JFU 0.016277 0.713592 0.032099 0.958804 0.612142
META 0.930311 0.533171 0.092231 -0.012607 0.341115
MSFT 0.412755 0.232601 0.029818 -0.629993 -0.472029
Volume AAPL -0.029512 0.311282 -0.115423 0.585409 0.459886
GOOGL -0.151856 -0.042062 -0.000509 0.269240 0.012021
JFU 0.070368 -0.005490 0.199057 -0.031394 0.244835
META -0.292884 -0.111849 -0.022038 -0.076521 -0.189726
MSFT -0.155827 0.014748 -0.010755 0.385456 0.002669
AAPL_RSI 0.004997 -0.083463 0.061414 0.173290 -0.021741
AAPL_MA50 0.125853 -0.024119 0.064262 -0.834666 -0.659242
AAPL_MA200 -0.465743 -0.191395 -0.203036 -0.610332 -0.854299
MSFT_RSI 0.094668 -0.049461 0.125818 0.128754 0.010838
MSFT_MA50 0.378591 0.334035 0.020917 -0.664905 -0.475025
MSFT_MA200 -0.250226 0.161366 -0.221518 -0.371834 -0.628478
GOOGL_RSI 0.143009 -0.062768 0.266579 0.119583 0.129097
GOOGL_MA50 0.487623 0.701526 0.015801 -0.540144 -0.277905
GOOGL_MA200 -0.143979 0.361218 -0.222673 -0.154512 -0.477958
META_RSI -0.178882 -0.382929 0.213837 0.096464 -0.180302
META_MA50 1.000000 0.726746 0.075377 -0.025740 0.416205
META_MA200 0.726746 1.000000 -0.029005 0.808407 0.393725
JFU_RSI 0.075377 -0.029005 1.000000 -0.078887 0.139101
JFU_MA50 -0.025740 0.808407 -0.078887 1.000000 0.585410
JFU_MA200 0.416205 0.393725 0.139101 0.585410 1.000000
AAPL_Prediction 0.154719 -0.116911 0.050904 -0.767557 -0.562317
MSFT_Prediction 0.393056 0.117118 0.116782 -0.571668 -0.458296
GOOGL_Prediction 0.642517 0.590318 0.119955 -0.507234 -0.164358
META_Prediction 0.768514 0.307906 0.121921 0.112358 0.293471
JFU_Prediction 0.157141 0.619181 -0.001170 0.870422 0.631696
AAPL_Prediction MSFT_Prediction GOOGL_Prediction \
Adj Close AAPL 0.905793 0.813605 0.746650
GOOGL 0.758888 0.826936 0.921140
JFU -0.825721 -0.656857 -0.573907
META 0.177138 0.392515 0.564483
MSFT 0.896489 0.905047 0.866042
Close AAPL 0.904094 0.813076 0.750773
GOOGL 0.758888 0.826936 0.921140
JFU -0.825721 -0.656857 -0.573907
META 0.177138 0.392515 0.564483
MSFT 0.888316 0.902444 0.872800
High AAPL 0.902242 0.808978 0.747621
GOOGL 0.761884 0.827124 0.920396
JFU -0.827379 -0.659121 -0.575090
META 0.178862 0.393142 0.566163
MSFT 0.889261 0.901329 0.871056
Low AAPL 0.905171 0.816284 0.754114
GOOGL 0.756282 0.825561 0.921340
JFU -0.823885 -0.654967 -0.573221
META 0.177900 0.393422 0.565503
MSFT 0.887989 0.903551 0.875149
Open AAPL 0.901991 0.810980 0.749967
GOOGL 0.756654 0.824351 0.920219
JFU -0.825333 -0.657569 -0.575928
META 0.176973 0.391980 0.565510
MSFT 0.887448 0.900908 0.872671
Volume AAPL -0.626398 -0.582726 -0.542105
GOOGL -0.229806 -0.209844 -0.240269
JFU -0.048769 -0.053369 -0.009978
META 0.099013 0.022033 -0.050103
MSFT -0.347067 -0.322639 -0.344415
AAPL_RSI 0.074507 0.073339 -0.002312
AAPL_MA50 0.855150 0.734534 0.689212
AAPL_MA200 0.553604 0.311595 0.062163
MSFT_RSI 0.008674 0.093762 0.064315
MSFT_MA50 0.855360 0.826590 0.830611
MSFT_MA200 0.508154 0.284234 0.185333
GOOGL_RSI -0.038234 0.025180 0.026912
GOOGL_MA50 0.707865 0.749496 0.868290
GOOGL_MA200 0.417426 0.256289 0.255506
META_RSI 0.076715 0.084179 -0.047988
META_MA50 0.154719 0.393056 0.642517
META_MA200 -0.116911 0.117118 0.590318
JFU_RSI 0.050904 0.116782 0.119955
JFU_MA50 -0.767557 -0.571668 -0.507234
JFU_MA200 -0.562317 -0.458296 -0.164358
AAPL_Prediction 1.000000 0.920492 0.801033
MSFT_Prediction 0.920492 1.000000 0.915262
GOOGL_Prediction 0.801033 0.915262 1.000000
META_Prediction 0.177418 0.411891 0.502900
JFU_Prediction -0.798886 -0.634606 -0.519674
META_Prediction JFU_Prediction
Adj Close AAPL 0.030167 -0.754602
GOOGL 0.314538 -0.484465
JFU -0.060635 0.937591
META 0.871229 -0.007773
MSFT 0.253607 -0.637924
Close AAPL 0.037728 -0.753689
GOOGL 0.314538 -0.484465
JFU -0.060635 0.937591
META 0.871229 -0.007773
MSFT 0.272042 -0.628735
High AAPL 0.030154 -0.756083
GOOGL 0.304948 -0.488231
JFU -0.053531 0.932589
META 0.869779 -0.010799
MSFT 0.261974 -0.630449
Low AAPL 0.045010 -0.751130
GOOGL 0.320520 -0.481783
JFU -0.065133 0.937953
META 0.871829 -0.007432
MSFT 0.280288 -0.627680
Open AAPL 0.037368 -0.754327
GOOGL 0.312320 -0.483112
JFU -0.060237 0.933641
META 0.870129 -0.007856
MSFT 0.269696 -0.628188
Volume AAPL -0.086503 0.481669
GOOGL -0.157585 0.227012
JFU 0.138511 -0.026518
META -0.352766 -0.179062
MSFT -0.214908 0.315142
AAPL_RSI 0.232205 -0.042733
AAPL_MA50 -0.186797 -0.723826
AAPL_MA200 -0.605863 -0.745617
MSFT_RSI 0.321655 0.096550
MSFT_MA50 0.023581 -0.576966
MSFT_MA200 -0.575541 -0.568458
GOOGL_RSI 0.359674 0.066181
GOOGL_MA50 0.076250 -0.408025
GOOGL_MA200 -0.517346 -0.425543
META_RSI 0.232550 -0.084670
META_MA50 0.768514 0.157141
META_MA200 0.307906 0.619181
JFU_RSI 0.121921 -0.001170
JFU_MA50 0.112358 0.870422
JFU_MA200 0.293471 0.631696
AAPL_Prediction 0.177418 -0.798886
MSFT_Prediction 0.411891 -0.634606
GOOGL_Prediction 0.502900 -0.519674
META_Prediction 1.000000 -0.040691
JFU_Prediction -0.040691 1.000000
[50 rows x 50 columns]
Plot correlation matrix with specified threshold
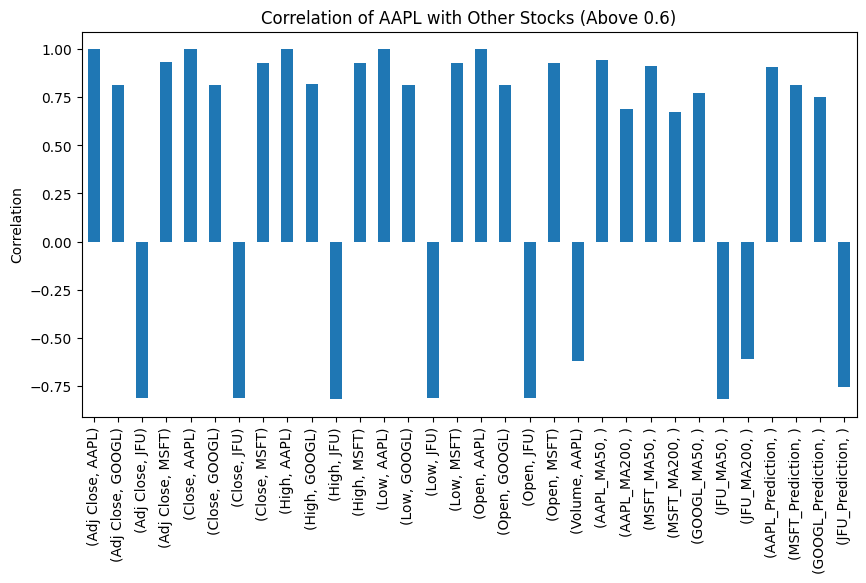
# Filter correlations for 'AAPL' above a threshold
threshold = 0.6
aapl_correlations = correlation_matrix['Close']['AAPL'][correlation_matrix['Close']['AAPL'].abs() > threshold]

# Plot 'AAPL' correlations
plt.figure(figsize=(10, 5))
aapl_correlations.plot(kind='bar')
plt.title('Correlation of AAPL with Other Stocks (Above 0.6)')
plt.ylabel('Correlation')
plt.show()
Benchmarking performance agaisnt S&P500
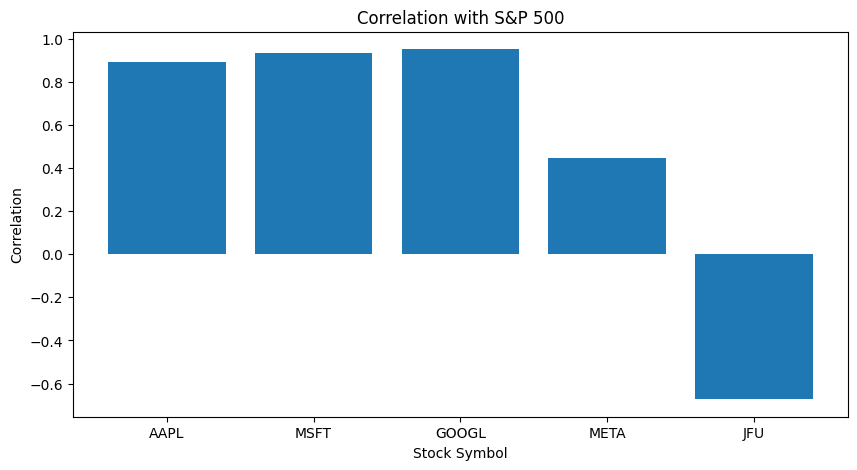
# Performance Measurement against S&P 500 Index
benchmark_data = yf.download('SPY','2020-01-01','2023-09-01')['Close']
for symbol in symbols:
   correlation_with_benchmark = data['Close'][symbol].corr(benchmark_data)
   print(symbol + " Correlation with S&P 500: ", correlation_with_benchmark)
[******100%%*******] 1 of 1 completed AAPL Correlation with S&P 500: 0.8900998247068898 MSFT Correlation with S&P 500: 0.9329114322662561 GOOGL Correlation with S&P 500: 0.95062462020499 META Correlation with S&P 500: 0.44587757367253394 JFU Correlation with S&P 500: -0.6723668544261696
# Performance measurement
benchmark_corr = [data['Close'][symbol].corr(benchmark_data) for symbol in symbols]
plt.figure(figsize=(10, 5))
plt.bar(symbols, benchmark_corr)
plt.title('Correlation with S&P 500')
plt.xlabel('Stock Symbol')
plt.ylabel('Correlation')
plt.show()
Risk Analysis
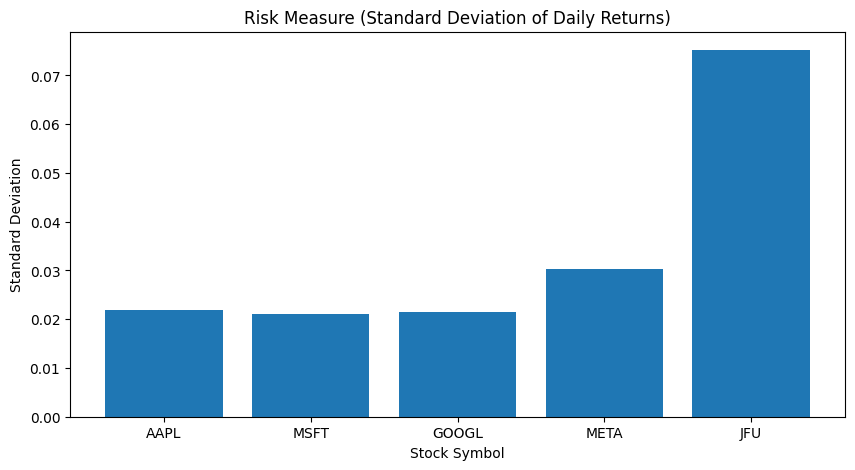
# Risk Analysis
for symbol in symbols:
   daily_returns = data['Close'][symbol].pct_change().dropna()
   risk_measure_std_deviation = daily_returns.std()
   print(symbol + " Risk Measure (Standard Deviation of Daily Returns): ", risk_measure_std_deviation)
AAPL Risk Measure (Standard Deviation of Daily Returns): 0.021819554790903452 MSFT Risk Measure (Standard Deviation of Daily Returns): 0.021118552747592577 GOOGL Risk Measure (Standard Deviation of Daily Returns): 0.021448103080327605 META Risk Measure (Standard Deviation of Daily Returns): 0.030356263394661093 JFU Risk Measure (Standard Deviation of Daily Returns): 0.07520947731438413
# Risk measurement
risk_measure_std_deviation = [data['Close'][symbol].pct_change().dropna().std() for symbol in symbols]
plt.figure(figsize=(10, 5))
plt.bar(symbols, risk_measure_std_deviation)
plt.title('Risk Measure (Standard Deviation of Daily Returns)')
plt.xlabel('Stock Symbol')
plt.ylabel('Standard Deviation')
plt.show()
Volatility measure (need to update metrics)
# Calculate daily returns and volatility for each stock symbol
for symbol in symbols:
    # Calculate daily returns
    data[symbol, 'Return'] = data['Close'][symbol].pct_change()

    # Calculate volatility as the standard deviation of returns
    volatility = np.std(data[symbol, 'Return'])

    # Assess volatility
    if volatility < 0.01:
        print(symbol + " is not volatile.")
    elif volatility < 0.02:
        print(symbol + " is moderately volatile.")
    else:
        print(symbol + " is very volatile.")
AAPL is very volatile. MSFT is very volatile. GOOGL is very volatile. META is very volatile. JFU is very volatile.
Summary and data visualization
# Summary statistics
for symbol in symbols:
    print(data[symbol].describe())
::: Return count 922.000000 mean 0.001233 std 0.021820 min -0.128647 25% -0.009473 50% 0.000776 75% 0.013371 max 0.119808 Return count 922.000000 mean 0.000997 std 0.021119 min -0.147390 25% -0.009659 50% 0.000642 75% 0.012283 max 0.142169 Return count 922.000000 mean 0.000976 std 0.021448 min -0.116341 25% -0.009595 50% 0.001072 75% 0.012120 max 0.092412 Return count 922.000000 mean 0.000843 std 0.030356 min -0.263901 25% -0.012657 50% 0.000683 75% 0.015070 max 0.232824 Return count 922.000000 mean -0.001938 std 0.075209 min -0.338109 25% -0.038044 50% -0.004408 75% 0.025286 max 0.836842
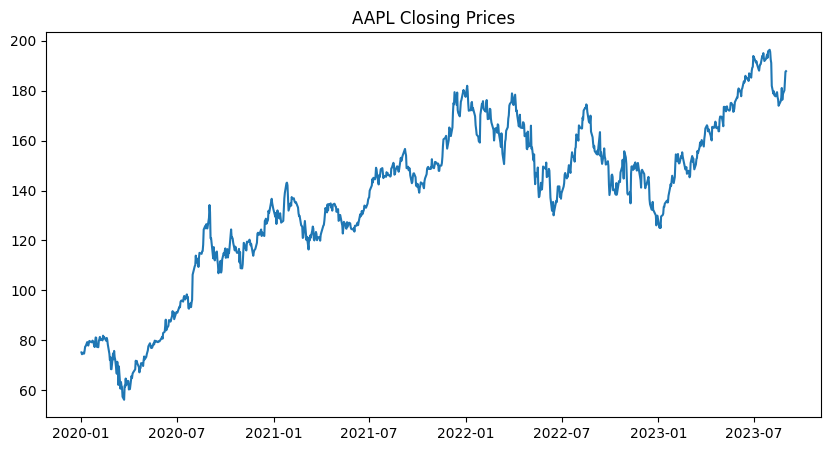
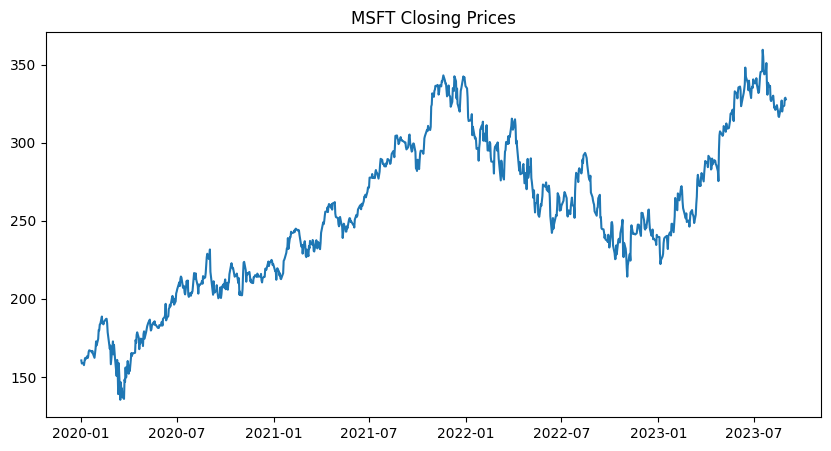
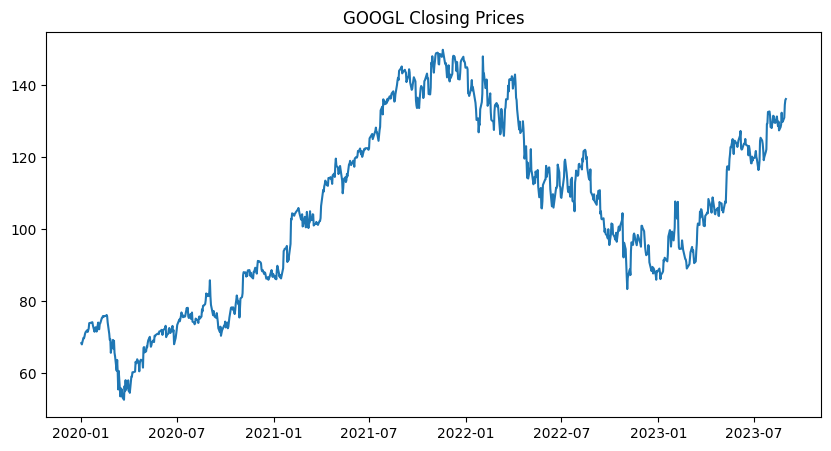
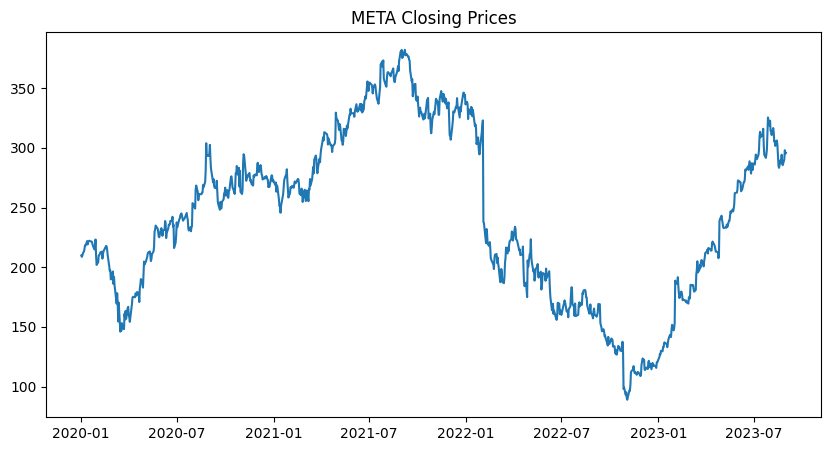
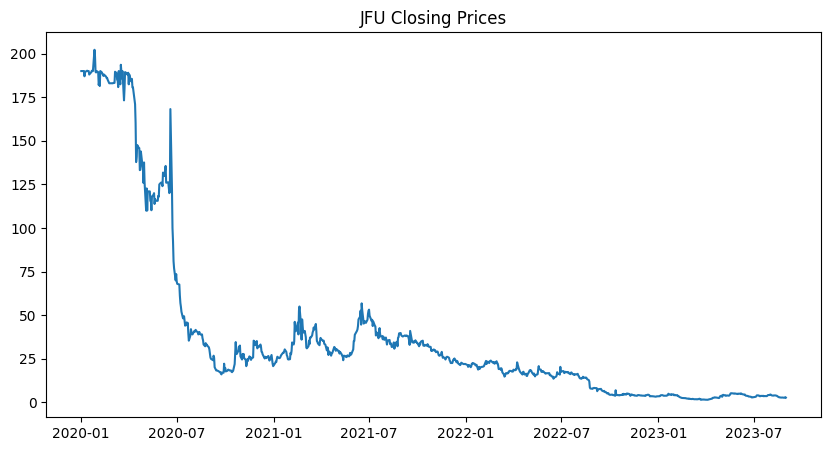
# Plot closing prices over time
for symbol in symbols:
    plt.figure(figsize=(10, 5))
    plt.plot(data['Close'][symbol])
    plt.title(symbol + ' Closing Prices')
    plt.show()
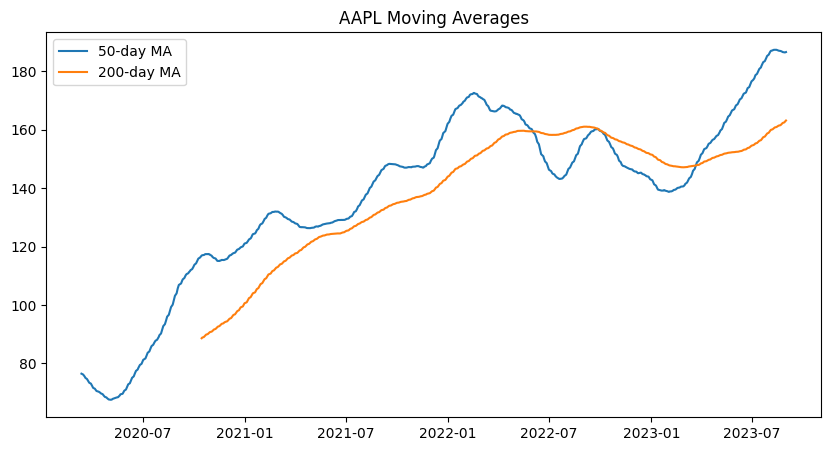
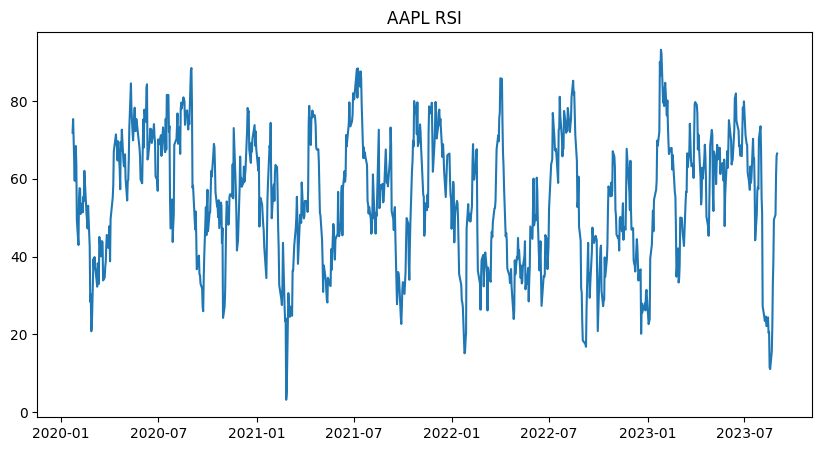
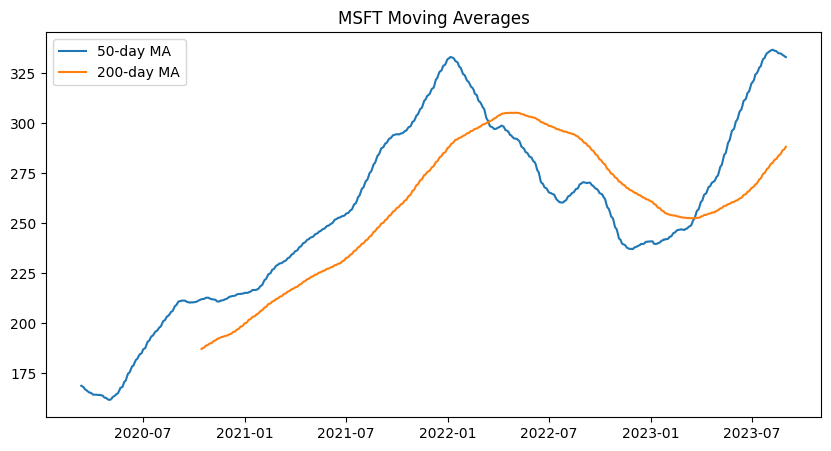
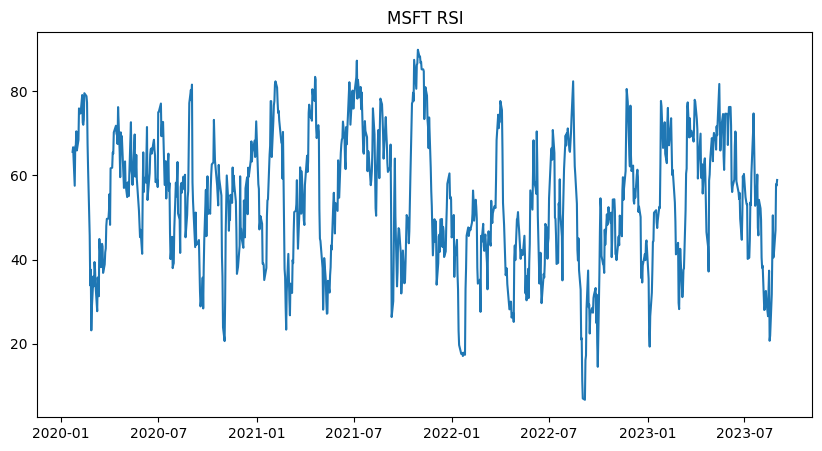
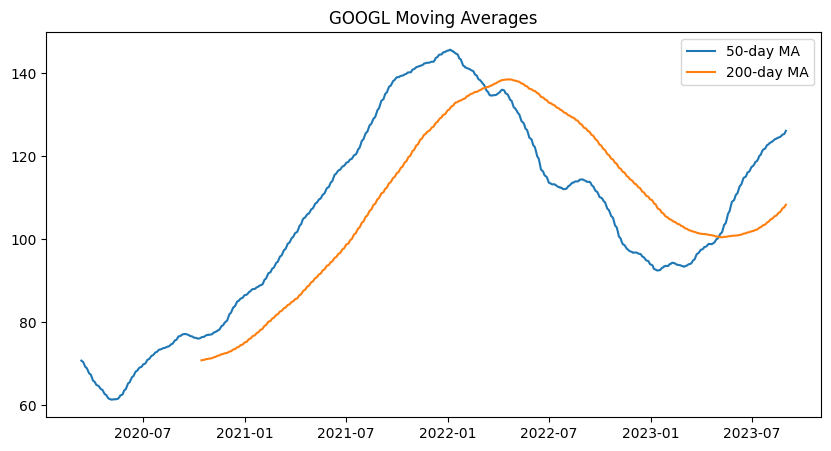
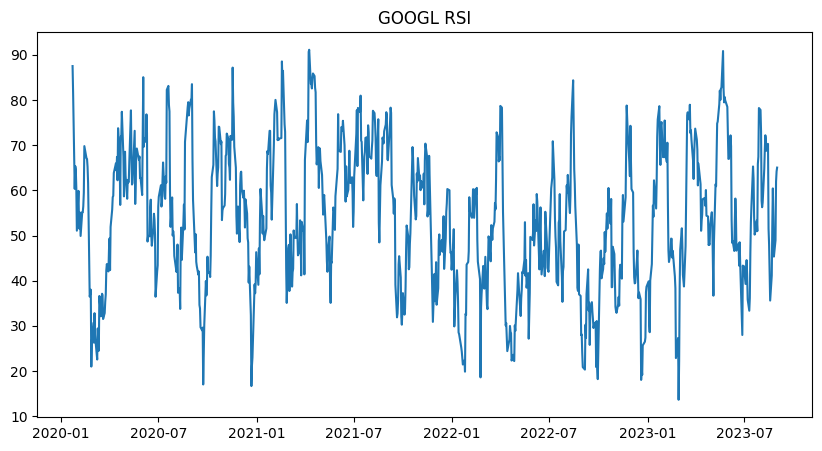
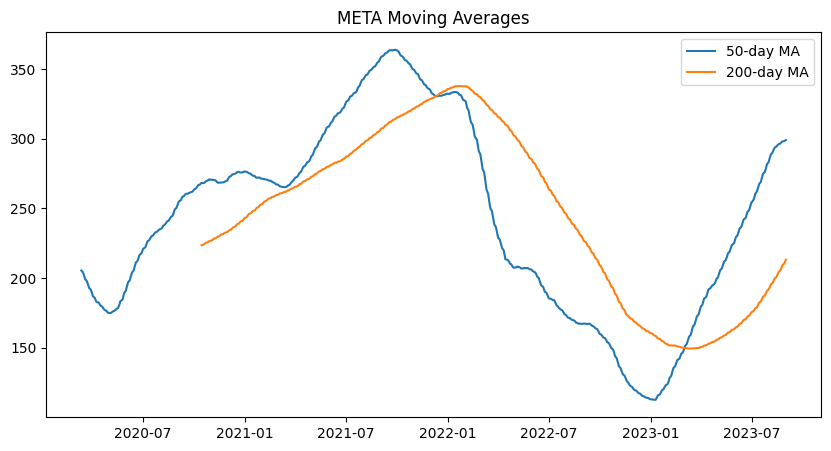
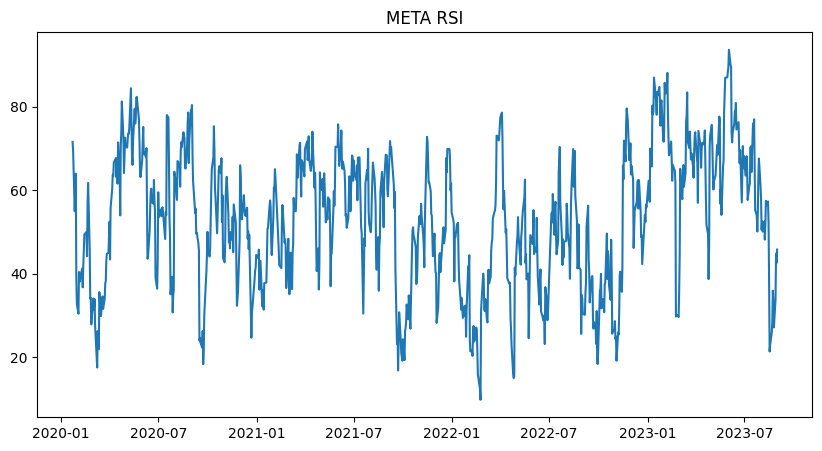
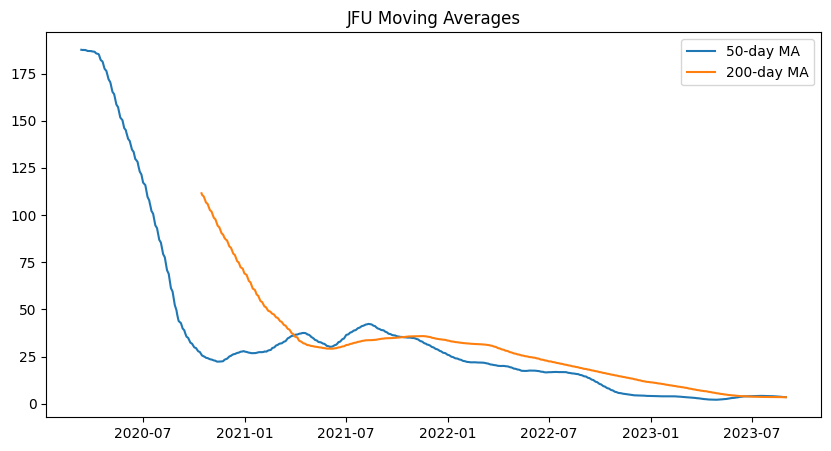
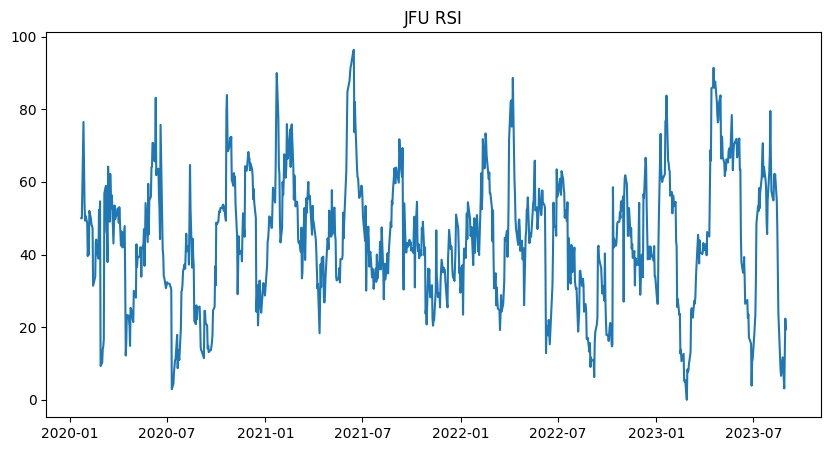
# Plot moving averages and RSI over time
for symbol in symbols:
    plt.figure(figsize=(10, 5))
    plt.plot(data[symbol+'_MA50'], label='50-day MA')
    plt.plot(data[symbol+'_MA200'], label='200-day MA')
    plt.title(symbol + ' Moving Averages')
    plt.legend()
    plt.show()

    plt.figure(figsize=(10, 5))
    plt.plot(data[symbol+'_RSI'])
    plt.title(symbol + ' RSI')
    plt.show()
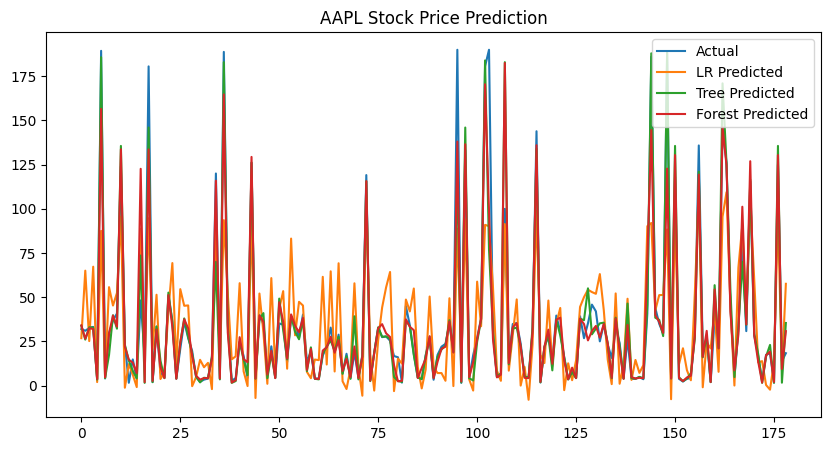
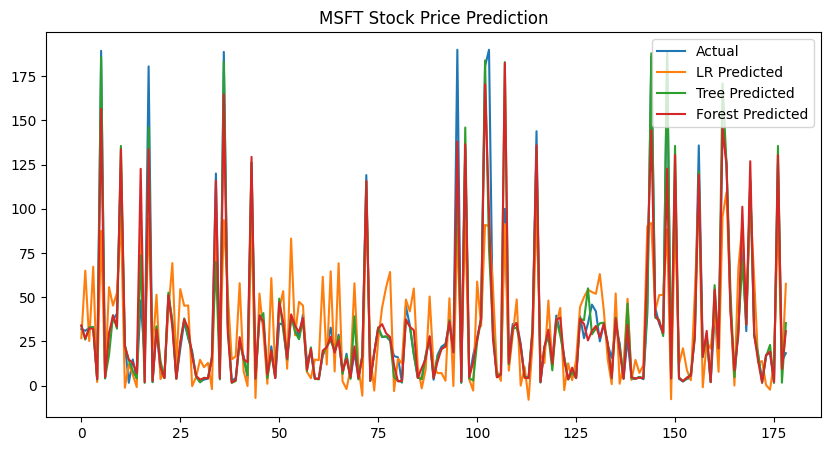
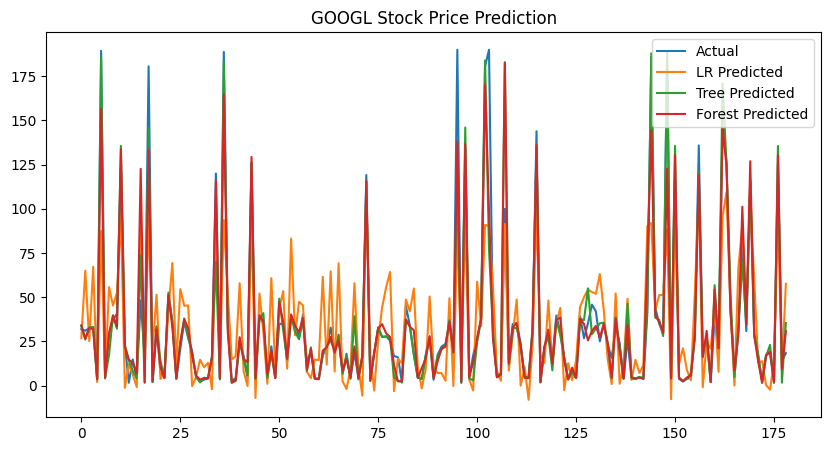
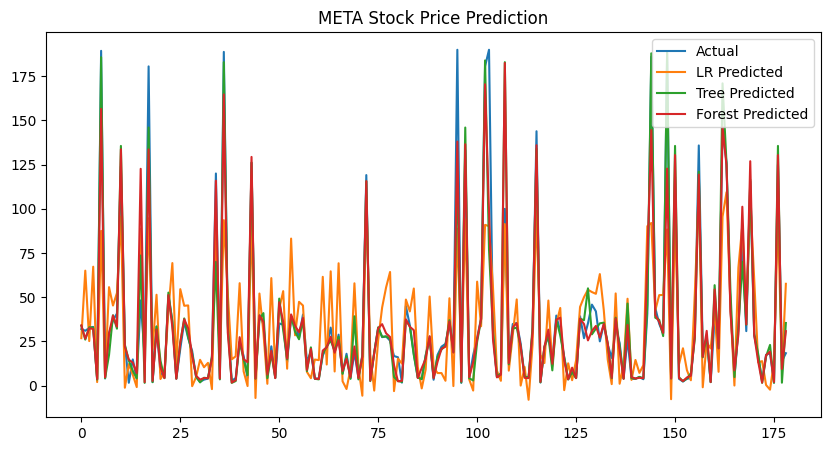
# Compare actual vs predicted prices
for symbol in symbols:
    lr_pred = lr.predict(x_test_pca)
    tree_pred = tree.predict(x_test_pca)
    forest_pred = forest.predict(x_test_pca)

    plt.figure(figsize=(10, 5))
    plt.plot(y_test, label='Actual')
    plt.plot(lr_pred, label='LR Predicted')
    plt.plot(tree_pred, label='Tree Predicted')
    plt.plot(forest_pred, label='Forest Predicted')
    plt.title(symbol + ' Stock Price Prediction')
    plt.legend()
    plt.show()
